
How are you doing on your journey of Wealth Building?
Are you on track? Ahead? Behind? Tough to know, right?
I take notice when I see a new tool being introduced in the financial blogging community, especially one which improves upon existing techniques and helps us monitor our journey toward Financial Independence. This post is about exactly that – a new wealth measurement tool “invented” by my friend JW over at The Green Swan. (He’s an awesome blogger by the way. Check out his site, you won’t be disappointed)
The FIRE Prowess Gauge
JW just invented a new wealth creation metric named the FIRE Prowess gauge. He wrote about it here, and his post led to this post. I’m hoping it leads to many more (See the P.S. section below).
I love this thing. It simply compares how much total income you’ve earned over a given period of time to how much wealth you’ve created, and gives you some guidance on how you’re doing on your journey toward Financial Independence. For example, if you earn $100 and your net worth increased by $50, your score would be .50, or 50%.
Wealth Created / Income Earned = FIRE Prowess Score Share on XIt’s easy, it’s intuitive and it gives you a sense of “How Am I Doing?. Finally, it allows folks to share their numbers without revealing anything too “personal”. Today, I’m going to show you how it works, using my own numbers in the explanation.
First, here’s the score of the only two bloggers on earth who have published their FIRE Prowess Scores:
- JW’s crushing it at 132% (Lifetime = 93%)
- I scored a 57%, (Lifetime = 44%)
Today, I’ll show you how I got that 57% (2016) and 44% (Lifetime), explain what the scores mean, and show how you can calculate your own score (it’s easy, trust me). I’ll use my own numbers to explain how the metric works.
I challenge you to run your own numbers and compare them to the scores above, it’s a fascinating exercise.

Don’t take my word for it, the concept is so good that it even won a Rockstar Award. (for those of you not aware of blogging sub-culture dynamics, a Rockstar Award is a big deal. I keep a list my Rockstar Award posts on this page on my website. Yep, big deal. Bottom Line: This is a good metric, even the experts like J$ agree.).
To demonstrate how good I think this metric is, see the open invitation to my blogging friends in the P.S. section of this post.
How this all started
When I read JW’s original post on the “FIRE Prowess Gauge”, I was immediately intrigued. I left the following comment on his post (turns out I was a bit optimistic in my view of my progress/score, though I did exceed 100% in 2013):

True to my word, I’m writing this article today, and present for full and transparent public disclosure “My Numbers” on The FIRE Prowess Gauge. I’m also starting a new Blog Chain, as you’ll see in the P.S. section below.
My FIRE Prowess Score
A score on the FIRE Prowess Gauge is very easy to calculate. In simple terms, it compares how much your true wealth (Net Worth) increases for every dollar you earn (Gross Income).
In a minute, I’ll show my progress over time. I’ve compared my income vs. net worth for the past 16 years, and will show you how my income has been used in growing my wealth.
First, here’s my score for 2016:
It’s fantastic in its simplicity. Simply pull your Gross Earnings (before tax) and your Net Worth change from year to year. Divide the two. and you have your number. Here’s the formula:
FIRE Prowess Ratio = Change In Net Worth / Gross Earnings
Calculating Your FIRE Prowess Gauge
I’ve spent an hour or so today tweaking some spreadsheets to calculate my FIRE Prowess Gauge score. It’s pretty easy when you pause for just a minute and study the methodology. In an hour, I was able to calculate my FIRE Prowess Score over the past 16 years and will share it with you below.
Are You Building Wealth? Cool new metric to measure Wealth Growth vs. Total Income. Share on XHere Are The Easy Steps To Calculate Your Score:
Step 1: Pull your gross adjusted income from your income taxes, or from Social Security (before taxes).
Step 2: Now, you pull your Net Worth figures from the beginning to the end of the period. Here’s a very simple example. For the sake of simplicity, I’m using figures that tie EXACTLY to the FIRE Prowess Score that I achieved for the year 2016, though the income and returns aren’t my actual numbers:

Step 3: Once you’ve gathered your numbers, the rest is simple math. Using the example above, we divide the change in Net Worth (+$56.8k) by the Gross Income ($100K), and we arrive at the result:
$56.8 k change in Net Worth / $ 100 k Gross Income = 56.8% FIRE PROWESS SCORE
It’s as simple as that. You can do it for a year, or you can do it for a decade. The longer the timeframe you use for your analysis, the more relevant your score. I just did it for 16 years, and it took me less than an hour.
My FIRE Prowess Score Over Time
JW is quick to point out that a single year’s FIRE Prowess Score (FPS?) can be misleading. It’s best to use this FPS metric over time, to compare the wealth you’re creating over a longer time frame vs. your income over the same period. This avoids “hiccups” in the trend (2008, anyone?), and gives you a more realistic view of how you’re doing over time.
I’ve done this exercise, and am excited to present to you today (for the first time in HISTORY)…
My FIRE Prowess Score since the year 2000:

The Blue Line above represents my annual FPS (FIRE Prowess Score) for each of the past 16 years (57% in 2016), and the Red Line represents my 5-year moving average (67%). The number that matters the most to me is presented below:
My Lifetime FPS Score: 43.9%
In fairness, my “working” lifetime is longer than 16 years, which is the timeframe I’ve used to calculate the 44% in the headline above. I’m planning to work this formula back to 1985 (32 years!), my starting year in Corporate America. For the sake of this article, I stopped at the most easily accessible numbers in order to share this concept with you, and start The Chain Gang (see the P.S. section for detail on The Chain Gang). So for now, I’ll peg my “Lifetime Score” at 44%.
I’m excited about this concept and was excited to share my results. Prior to publishing this article, I sent this tweet to JW @TheGreenSwan1 to announce my Fire Prowess Score to the world:

What Does Your FPS Score Mean?
JW includes the following guide to help interpret your Financial Prowess Score. I’ve thought about it as I’ve written this post, and cannot raise any substantial disagreement with JW’s ranking system.
As a reminder, my 2016 score is .57, my 5-year moving average is .67 and my “LIfetime score” is .44:
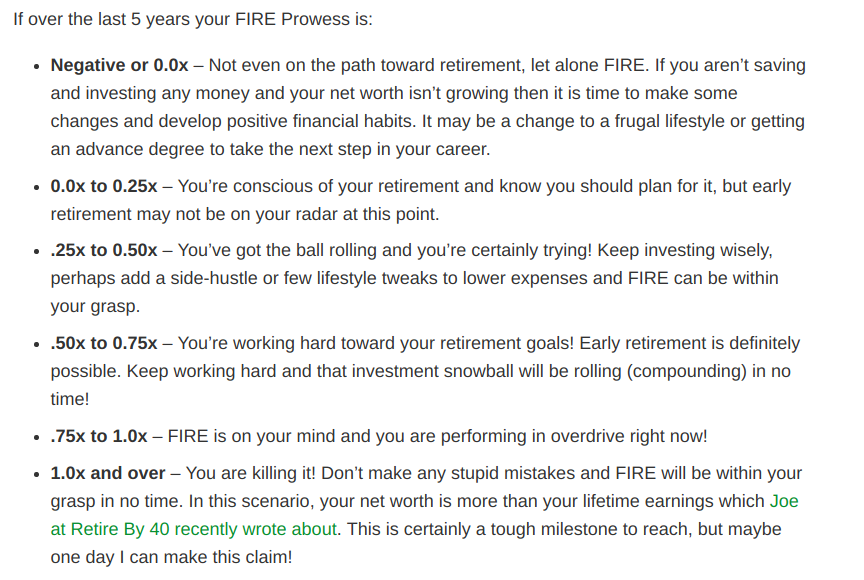
My LIfetime score of .44 puts me in the “Top End” of the .25-.50 range, which means “I’ve got the ball rolling…..FIRE can be within your grasp.” My 5-year rolling average of .67 says that “FIRE is on your mind and you are performing in overdrive right now”.
Given that I’ll retire at the age of 55, I’d say the ranking is pretty accurate. FIRE is within my grasp, and I AM in Overdrive right now. I’m doing well, but I’m not crazy-early FIRE like some seek to attain. The score reflects that. It works, at least in my situation. The more aggressive you’re being toward FIRE, the higher your score.
Bottom Line: The FIRE Prowess Gauge is a good metric, and provides a tool that you can you use as you evaluate where you are on your road to Financial Independence.
Conclusion
The FIRE Prowess Gauge is a simple metric to check your progress on your journey toward Financial Independence. It’s easy to calculate, and quickly answers the question of “How Am I Doing” regardless of your income or savings. It works in whatever situation you’re in (pre-retirement only, I’m afraid, as the results are skewed after you retire), and gives you a way of comparing where you’re at versus others on your road to retirement.
Calculate your FIRE Prowess today. Take a few minutes (it’s worth the time), and calculate your FIRE Prowess Score, then compare your result to the ranking system provided above, and to other bloggers in The Chain Gang in the P.S. section below. Does your score accurately reflect your situation and your position on the road to FIRE?
Mine was pretty darn accurate. See the PS section below, and check back in over the coming weeks as we track others who calculate their FIRE Prowess Score. I’ll keep track of every blogger who posts their FIRE Prowess score in the P.S. section below. Feel free to send me your number, it’ll be interesting to compare how we’re all doing, and whether this score is an accurate reflection of your progress on your path toward Financial Independence.
PS – The FIRE Prowess Score: The Chain Gang
JW and I have chatted and would like to invite other bloggers to join in the sharing of The FIRE Prowess Gauge concept via a new Chain Gang. If you want in, here’s all you need to do:
- Write a post on the topic, run your numbers, give some commentary on how accurate a gauge you think this is.
- Include a link to every other blogger who has written ahead of you in The Chain somewhere in your post.
- Tag all other bloggers ahead of you in “The Chain Gang” via Twitter when you finish your post (this will take several tweets as the chain grows).
- As a courtesy, attempt to keep “The Chain” updated in your post as others join behind you. Give them a backlink. This isn’t mandatory, as it’s a bit burdensome, but you’re encouraged to support the request if you can.
We did this with the recent “Retirement Drawdown Strategy” Chain Gang (currently at 18 bloggers in that Chain Gang, check it out at the end of this post), and we think it may work again here.
The FIRE Prowess Gauge for wealth creation is fantastic in it's simplicity. Join The Chain Gang Share on XJW and I hope you accept our invitation to join The Fire Prowess Chain! I’ll add each member of the Chain Gang to the official chain below when I get your Tweet. We’re also tracking it in the Rockstar Forum in this thread.
The Official FIRE Prowess Score Chain Gang:
- Anchor: The Green Swan – The Swan’s FIRE Prowess Gauge 2016: 132% Lifetime: 93%
- Link 1: The Retirement Manifesto – Is Your Wealth Building On Track? 2016: 57% Lifetime: 44%
- Link 2: OthalaFehu – My Swan FIRE Prowess Numbers 2016: 72% Lifetime: 61%
- Link 3: Budget On A Stick – My FIRE Prowess Score 2016: 52% Lifetime: 55%
- Link 4: Shnugi – Calculating My Savings Rate 2016: 71% Lifetime 54%
- Link 5: Dads Dollars Debt – DDD’s FIRE Prowess 2016: 26% Lifetime 32%
- Link 6: Debts To Riches – My FIRE Prowess Report Card 2016: 29% Lifetime 43%
- Link 7: Adventure Rich – The Adventure Rich FIRE Prowess Score 2016: 45% Lifetime 47%
- Link 8: Freedom Is Groovy – The Groovies FIRE Prowess Score 2016: 163% Lifetime 90%
- Link 9: Working Optional – Calculate Your Progress To Financial Freedom 2016: 97% Lifetime 75%
- Link 10: Budgets Are Sexy – My Total Lifetime Wealth Ratio: 2016: 135% Lifetime 60%
- Link 11: Life Zemplified – FIRE Prowess Score for Life Zemplified 2016: 78% Lifetime 76%
- Link 12: Physician’s Wealth Services – Physician Wealth’s FIRE Prowess 2016: 43% Lifetime 46%
- Link 13: Married And Harried – Married And Harried FIRE Prowess Score 2016: 32% Lifetime 14%
- Link 14: Ms. Liz Money Matters – Introducing the FIRE Prowess Score 2016 279% Lifetime 72%
- Link 15: Actuary On Fire: The Swan’s FIRE Prowess Gauge 2016 61% Lifetime 59%
- Link 16: Trail To FI: FIRE Prowess Score, Trail to FI Edition 2016 34% Lifetime 53%
- Link 17: Maximum Cents: Maximum Cents’ FIRE Prowess Score 2016: 94% Lifetime: 70%
- Link 18: Retiring On My Terms: ROMT’s FIRE Prowess 2016: 119% Lifetime: 57%
- Link 19: Minafi: The Minafi FIRE Prowess Score 2016: 74% Lifetime: 94%
- Link 20: Military Dollar: FIRE Prowess Scores and How to Correct for Military Paychecks 2016 81% Lifetime 83%
- Link 21: Finance Yo Self: FIRE Prowess Score for Finance Yo Self 2016: 44% Lifetime: 44%
- Link 22: The 7 Circles: FIRE Prowess Gauge 2016: 246% Lifetime: 219%
- Link 23: Money Metagame: The Good, Bad & Ugly of the New FIRE Prowess Gauge 2016: 108% Lifetime 68%
- Link 24: Summit Of Coin: Savings Rate or FIRE Prowess Score? 2016: 36% Lifetime 46%
Readers In The Chain:
- Daren: FIRE Prowess Score 2016: 78% Lifetime: 47%
- Todd: FIRE Prowess Score 2016: 75% Lifetime: 29%
Great Idea again Fritz, I think I am up and running 6:10AM
Wow, you’re quick! You’re officially in as Link #2 on the chain! Congrats on your strong score!
Genius! Thank you JW, and thank you Fritz. Just calculated my FIRE Prowess Gauge for 2016: 1.63. That’s no doubt an anomaly. My guess is that over the past 10 years it’s in the .50 range. For my lifetime? Probably in the .20 range. We’ll find out with tomorrow’s post.
I’m looking forward to the post, Mr. Groovy!
WHOA!! 1.63? No wonder you and Mrs. G are retired, and I’m not! Congrats on a great year, looking forward to your longer term numbers (and, of course, our phone chat tomorrow night!).
That’s great, Fritz! The more folks willing to enter the “trust tree” and share their FIRE Prowess the better. It helps me, and I presume other readers, to have benchmarks out there to pursue.
The real question though…how is your FIRE Prowess Score going to shape up for 2017 with that Bahamas trip you went on 🙂
That hurt, JW. Worth every penny, tho! Sometimes you’ve gotta live a little, right! Congrats on “inventing” the FIRE Prowess Score, excited to see so many folks jumping on the chain so quickly. I think you’re on to something….
Very nice! I’ll be adding ours shortly, but we have a mere 2 years to go on (I started calculating Net Worth in 2015!), so ours will be a “baby swan prowess score” 😉
Nothing wrong with 2 years! Looking forward to having you in the chain!
I am up and running…Great work with the score Green Swan. Fritz, your lifetime FIRE Prowess gives me hope as I am not far behind….though I have some work to do. It is a cool tool and I am glad you started the chain.
89%. But I think the rentals are giving us a somewhat unrealistic boost from an overinflated housing market, which, plus our own house, really inflates net worth.
Good point on real estate. I’ve always struggled with housing valuation on my personal net worth, too.
Working Lifetime (20 years): 0.47
2016: 0.78
5 year moving ave: 0.80
10 year moving ave: 0.60
I think the FIRE Prowess is possibly a decent metric of how you’re doing; but like some of the others I track (Tom Stanley, Marotta, Expected Physician Net Worth) it’s very heavily dependent on stock market performance, if you’re following a traditional investment track.
So wouldn’t put much stock in anything but the 10 year moving average. Unfortunately, this means you need 11 years of data before you can calculate how you’re doing.
Because of the stock market dependence, you will naturally APPEAR to be doing better over time (as the market tends to rise). So I’m really not sure if it’s telling you squat. When I retire (and AGI goes to 0), the indicator will obviously skyrocket!
For what it’s worth, here’s my 10 year moving average over time:
2006 33%
2007 35%
2008 24%
2009 26%
2010 42%
2011 42%
2012 54%
2013 63%
2014 64%
2015 58%
2016 60%
I wish I could say the improvement was all due to my improved frugality & financial savvy, but I’ve been investing the same way all the time, and always about 30% of my income. So I’m still not sure what to make of this; would be interested in other’s thoughts about this. Just trying to stir the pot a little.
Daren, thanks for running your numbers, you’re doing well. I agree on the impact of the market, but that’s also something I like about this metric that many others don’t track. Take a look at Shnugi’s post (click here), he’s done some pretty cool calc’s on the impact of compounding on the FIRE Prowess Score over time, and he predicts exactly the type of steady increase you’ve seen with your numbers.
Rachel, no worries. The fact that you’re tracking your Net Worth at age 26 puts you miles ahead of most of your peers! Now you’ve got a new metric you can add to your spreadsheet, and track it over time! We’ll still be here in January, I’ll look forward to your post whenever you write it!
Fun! I figured my score out the other day, now I just need to write the post.
Can’t wait! Guess you’re going to keep us in suspense until your post comes out? 😉
Great concept and it’s another good metric to slice and dice years worth budgeting data.
Why is the gross earnings value used and not Net earnings value? For me gross earnings is not a realistic number because as a sales rep, commissions were taxed at a much higher rate. Net income is what I walk away with to cover costs, save and invest.
Either way life time is 44% using the prescribed method and went back to age 16 since I had the government data. A good place to be.
I love this metric. Simple and scalable. Our 2017 YTD is 31% and full working lifetime is only 14%. Jumping on this chain gang like Sam Cooke.
Interesting metric and agree with the thread on the various caveats to the score. e.g. RE. A number of nice posts on it already so we won’t jump in and add our fuel to the prowess FIRE.
Anyway, a couple of recent numbers for us:
2016 80%
2017 92% already. Of course assuming we do (a) no more saving and (b) market does nothing)
For (a), we will continue to save. For (b), let’s see….
The partial year of 2017 – we each get performance bonuses in first half of year so a lot of our savings are front-loaded so to speak. Our investments this year have done rather well so far, particularly international developed and emerging markets.
Just a reminder to add my post to Link 17. Maximum Cents: Maximum Cents’ FIRE Prowess Score https://www.maximumcents.com/maximum-cents-fire-prowess-score/ 2016: 56% Lifetime: 70%
Good work and thx to share your numbers.
We are in 2016 at approx 0,6. It is hopefull. I rely on your numbers to put 55years as my FIRE age. Only 14 left. That is waht my calculators tell me. For us, it comes at the right balance between now and later.
Then again, doing FIRE when the kids marry would not be bad as well. It is less in my control!